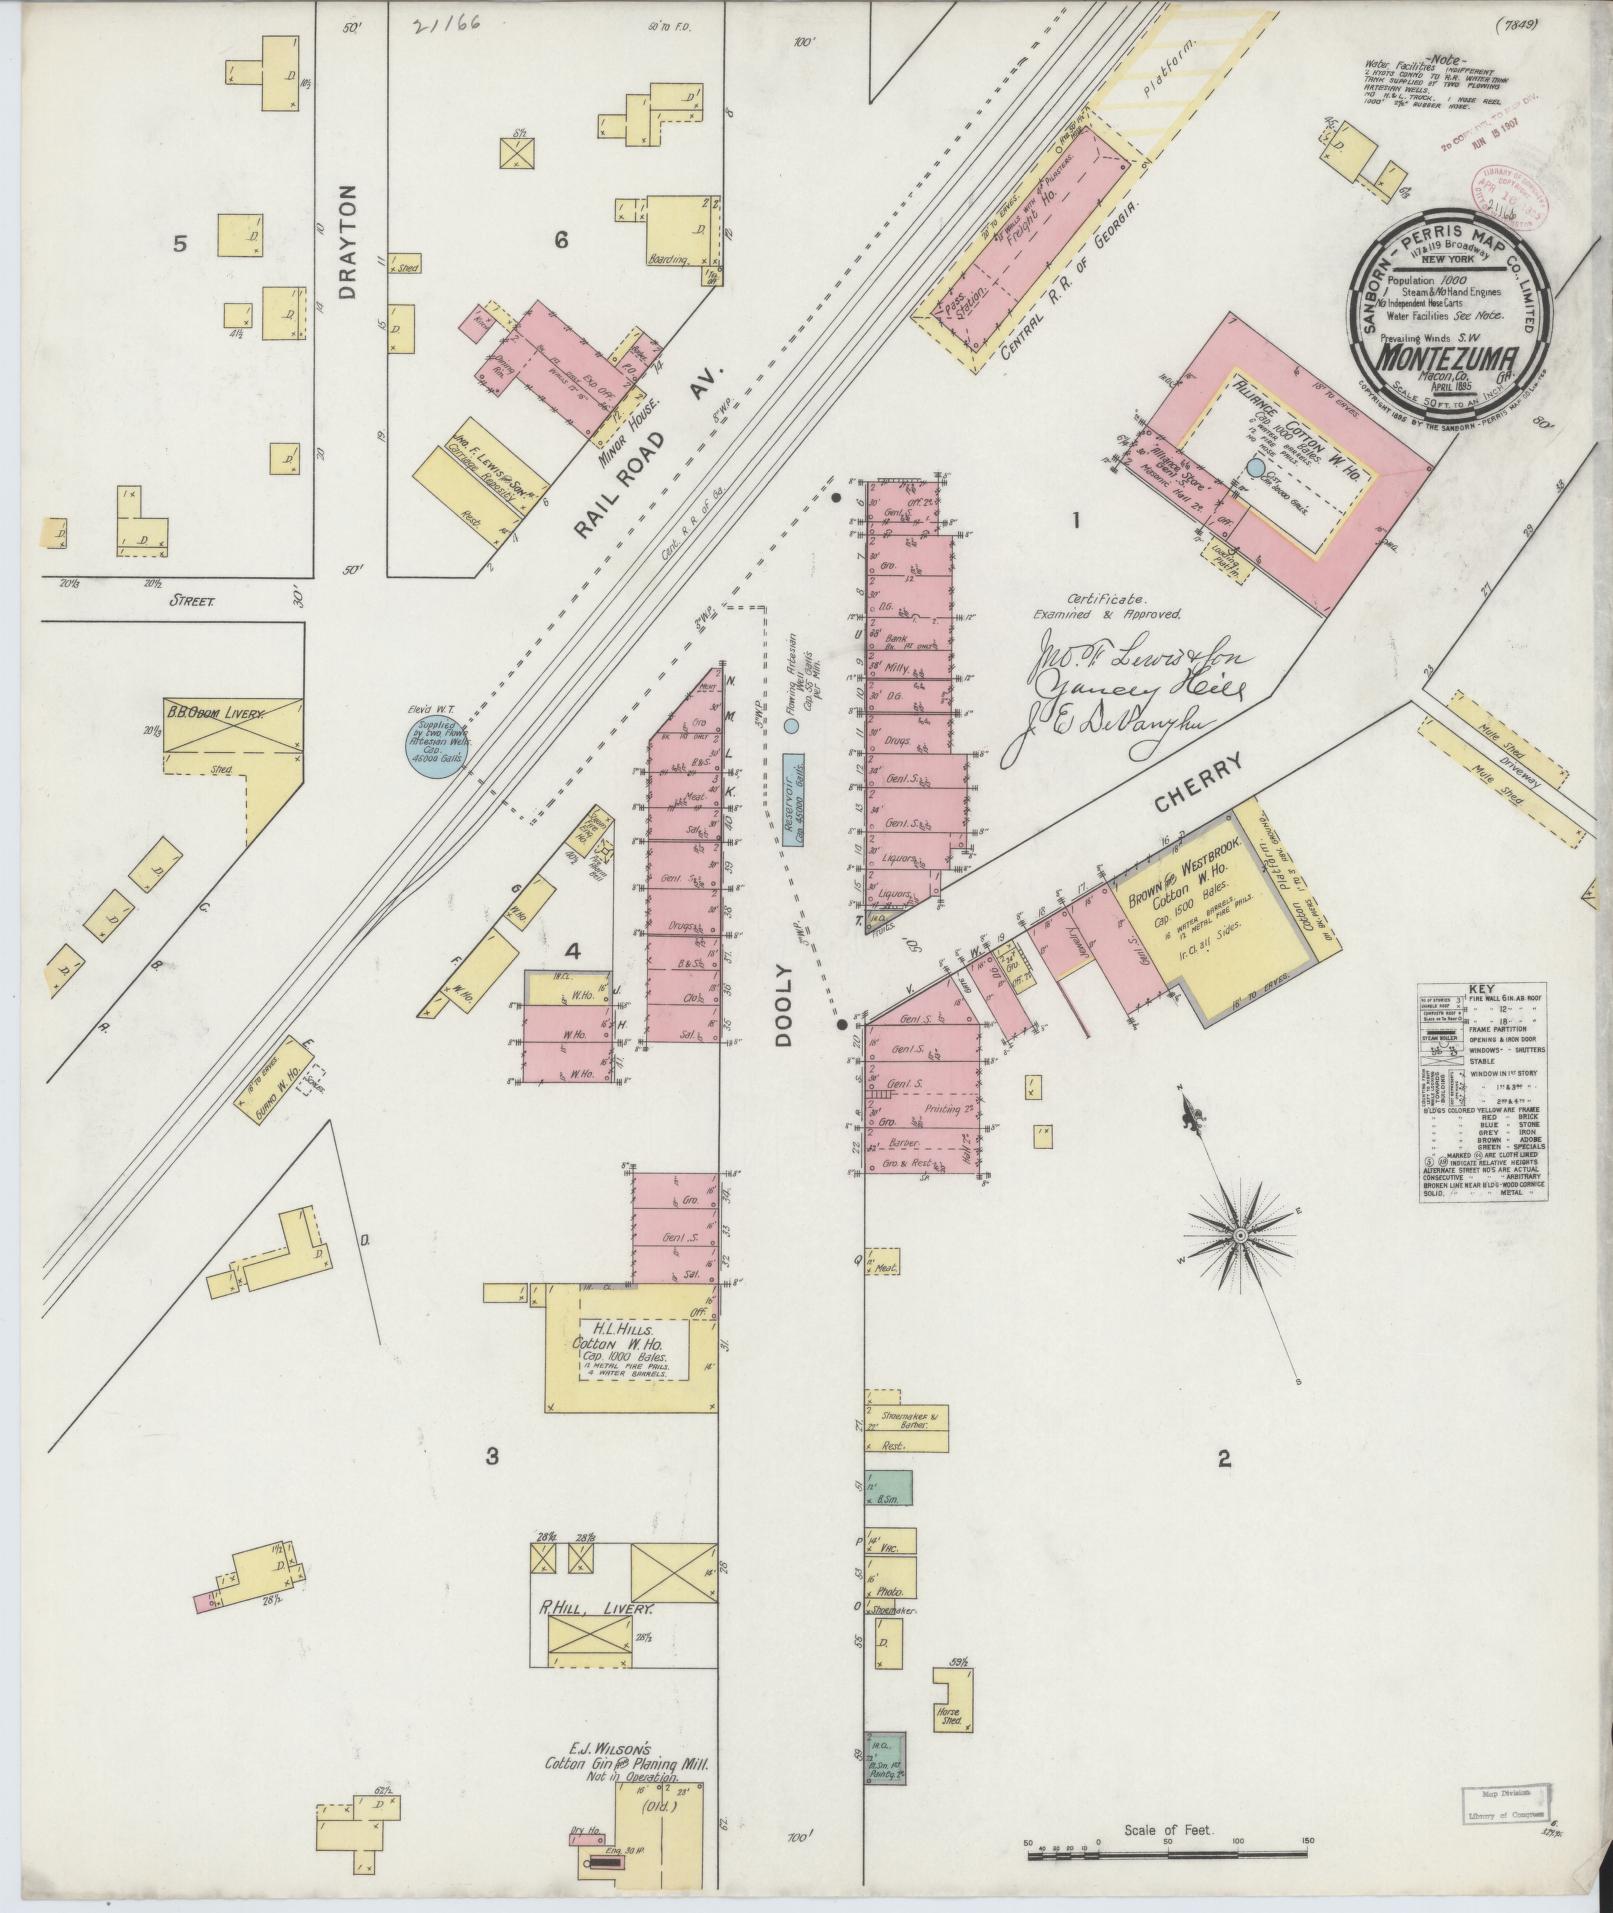
A census table can look definitive because the columns are tidy and the numbers feel official. But a table is not the whole community story. It still needs geography, universe, estimate type, year, margin of error, and local context before a reader can safely turn it into a claim about how people live.
CultureUp should use census tables as a starting record, not as a shortcut around community reality. Official numbers are powerful, but they can still be misread when the page leaves out what the table is actually measuring.
Opening context
The attached census-facing sources already support this method. They give the page enough footing to explain why geography, estimate type, and release context matter before a community claim becomes trustworthy. That is the right lane for a short standards brief: not anti-data, but pro-context.
The core story
A table can tell you a lot, but only if you know what it is counting. Is the number about households, individuals, a city, a tract, a metro area, or a survey estimate? Is it a one-year estimate or a five-year estimate? Does it describe a total, a change, or a rate? Those questions are not technical clutter. They are what keep the page from turning one official cell into an oversized social conclusion.
That is why the community story has to stay larger than the table. The data can help frame the place, but the interpretation still needs release notes, geography, and often on-the-ground context to keep the claim honest.
What the record shows
The current sources support a practical reading habit: identify the census product, the place, the counted population, and the method note before drawing a conclusion. That is enough to turn a raw number into a careful context sentence rather than a sloppy identity claim.
Reader verification card
| Check | Why it matters |
|---|---|
| Geography | Shows where the number actually applies |
| Universe and estimate type | Prevents confusion about who is being counted and how |
| Method or margin note | Keeps a precise-looking figure from being overstated |
What the record does not show
A table does not automatically explain why a change happened, how people experience it, or what local institutions are doing in response. It is evidence, not the full narrative.
Why this matters for CultureUp readers
Readers who learn to inspect census context become harder to mislead. They can still use the number, but they are less likely to confuse official formatting with total explanation.
Readers are often most vulnerable when a table seems to confirm something they already believe about a neighborhood or population. That is exactly the moment when method needs to slow them down. The page should help them ask whether the number is actually measuring the thing they think it is measuring.
A strong census explainer therefore does two jobs at once: it gives readers permission to use official data, and it teaches them not to overuse it. That balance is what keeps the site pro-evidence without becoming data-naive.
This is also where release notes matter. A table can move from one release to another with methodology changes, updated universes, or different estimation windows that alter comparability. Readers deserve to know when the number is stable and when the frame has shifted under it.
A community story gets stronger, not weaker, when it admits that official data has boundaries. The admission protects the reader from certainty theater.
Media and caption note
Data explainers should prefer reviewed charts or official-source visuals that clarify method and place. The image should support reading discipline, not turn the number into aesthetic proof.
Source notes and correction path
Published source brief. Sources include U.S. Census Bureau ACS data, data profiles, and guidance for data users.