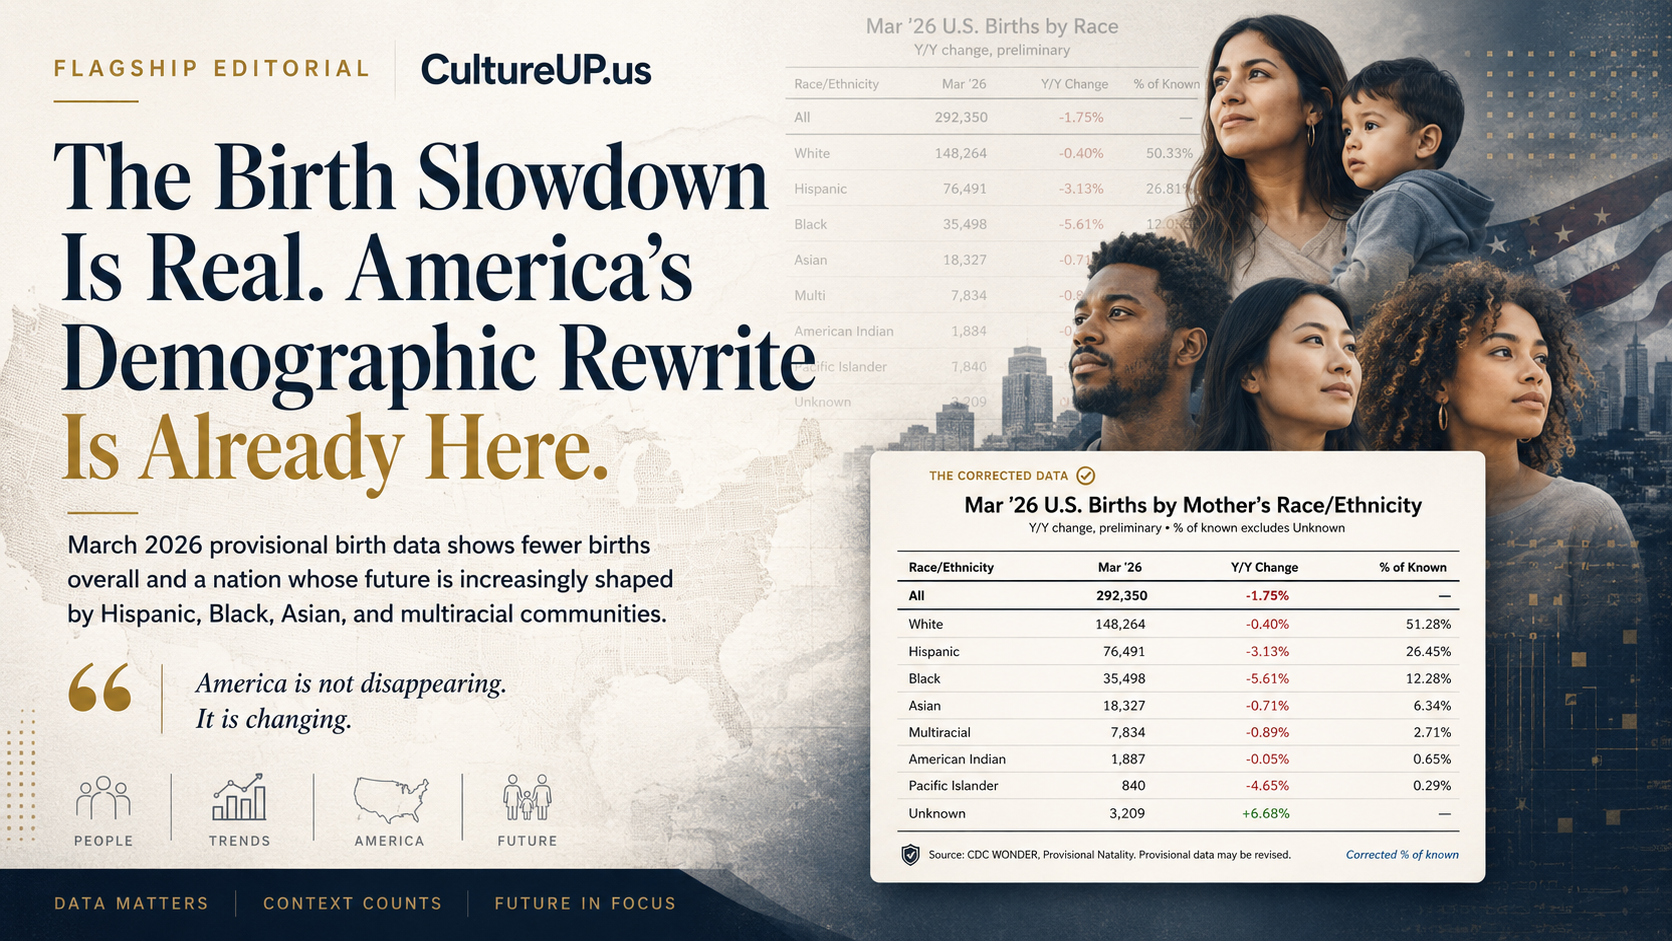
America's birth story is no longer a niche demographic debate. It is a planning problem for school districts, hospitals, housing markets, employers, and local governments that still operate as if family formation is returning to an older norm. The March 2026 provisional birth file does not settle every argument, but it does sharpen a pattern that has already been visible for years: fewer births overall, tighter margins inside the largest birth categories, and a more plural next generation already arriving.
CultureUp is treating this as a source-aware flagship analysis, not as a panic headline. The monthly file is provisional, the categories reflect mother's race and Hispanic origin rather than a complete identity claim about the child, and one month should never be mistaken for an annual verdict. But institutions do not get to wait for perfect certainty before they plan. They have to work with credible signals, explain the limits, and adapt before the lag becomes damage.
America is not disappearing. It is changing.
Opening context
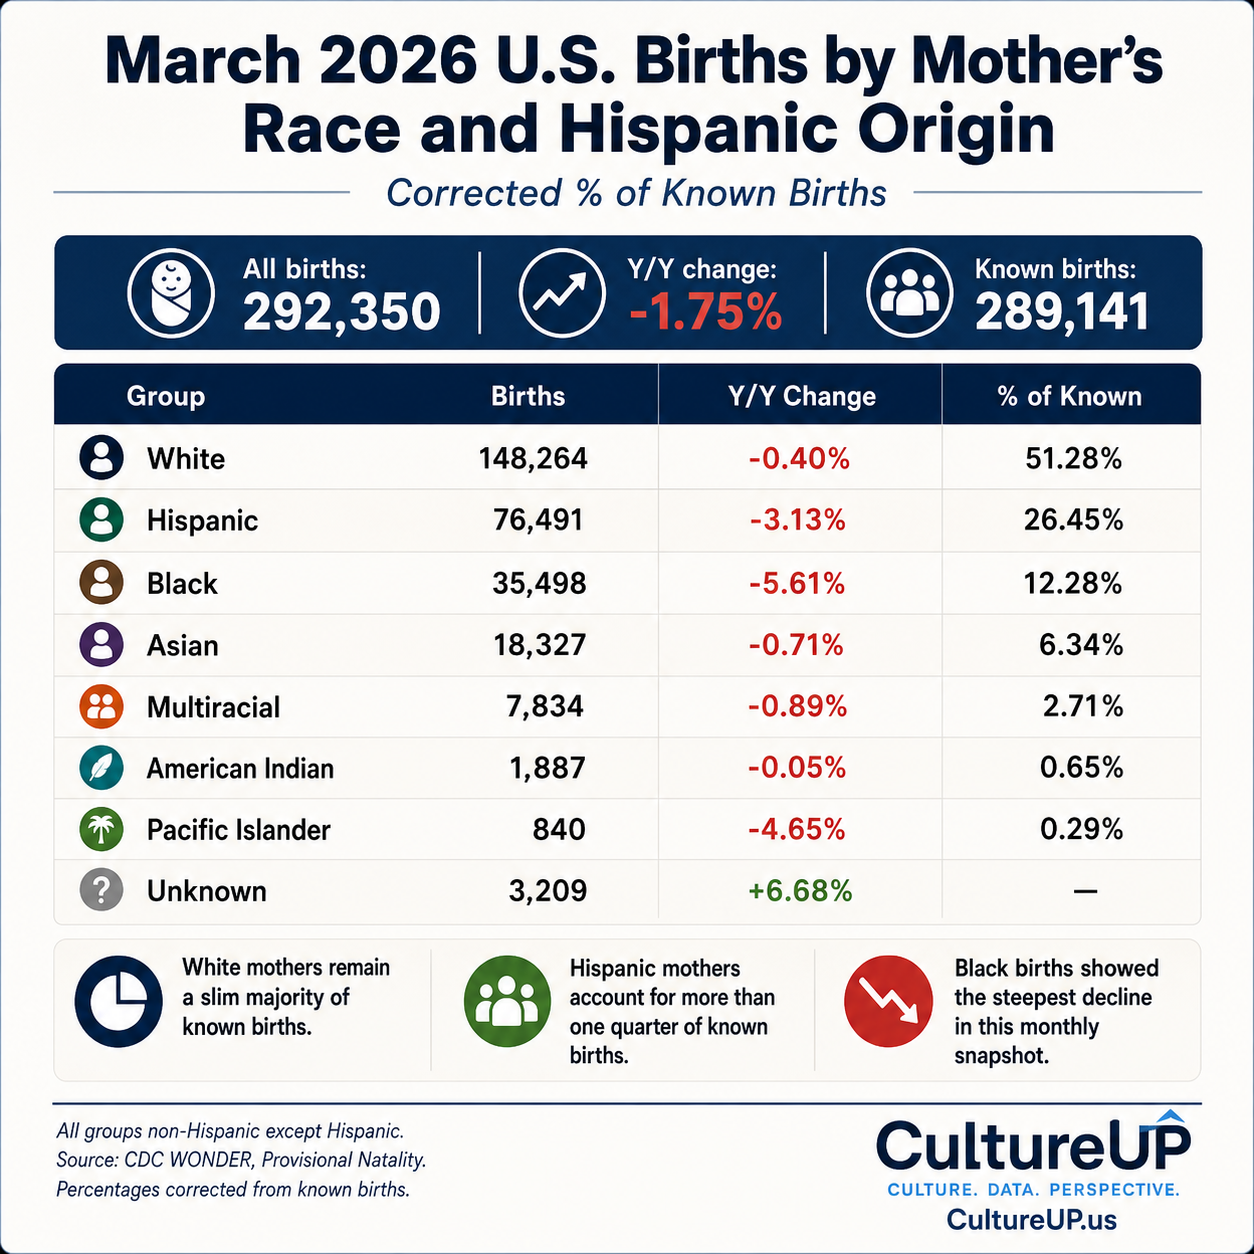
Using the corrected March 2026 table, the United States recorded 292,350 total births, down 1.75% year over year. Removing 3,209 unknown records leaves 289,141 known births. On that corrected denominator, non-Hispanic White mothers accounted for 51.28% of known births, Hispanic mothers for 26.45%, Black mothers for 12.28%, Asian mothers for 6.34%, multiracial mothers for 2.71%, American Indian mothers for 0.65%, and Pacific Islander mothers for 0.29%.
Those numbers matter because they force two stories onto the same page. The first is the low-birth story: the country remains below the family-formation levels many institutions still quietly assume. The second is the composition story: even within a low-birth environment, the population being born is increasingly shaped by communities that older national narratives still treat as secondary. Both stories are real at once.
Corrected March 2026 Provisional Births
Percentages use known births as the denominator: 292,350 total births minus 3,209 unknown births equals 289,141 known births.
| Group | Births | Y/Y Change | Correct % of Known |
|---|---|---|---|
| All | 292,350 | -1.75% | Not calculated |
| White | 148,264 | -0.40% | 51.28% |
| Hispanic | 76,491 | -3.13% | 26.45% |
| Black | 35,498 | -5.61% | 12.28% |
| Asian | 18,327 | -0.71% | 6.34% |
| Multiracial | 7,834 | -0.89% | 2.71% |
| American Indian | 1,887 | -0.05% | 0.65% |
| Pacific Islander | 840 | -4.65% | 0.29% |
| Unknown | 3,209 | +6.68% | Not calculated |
The core story
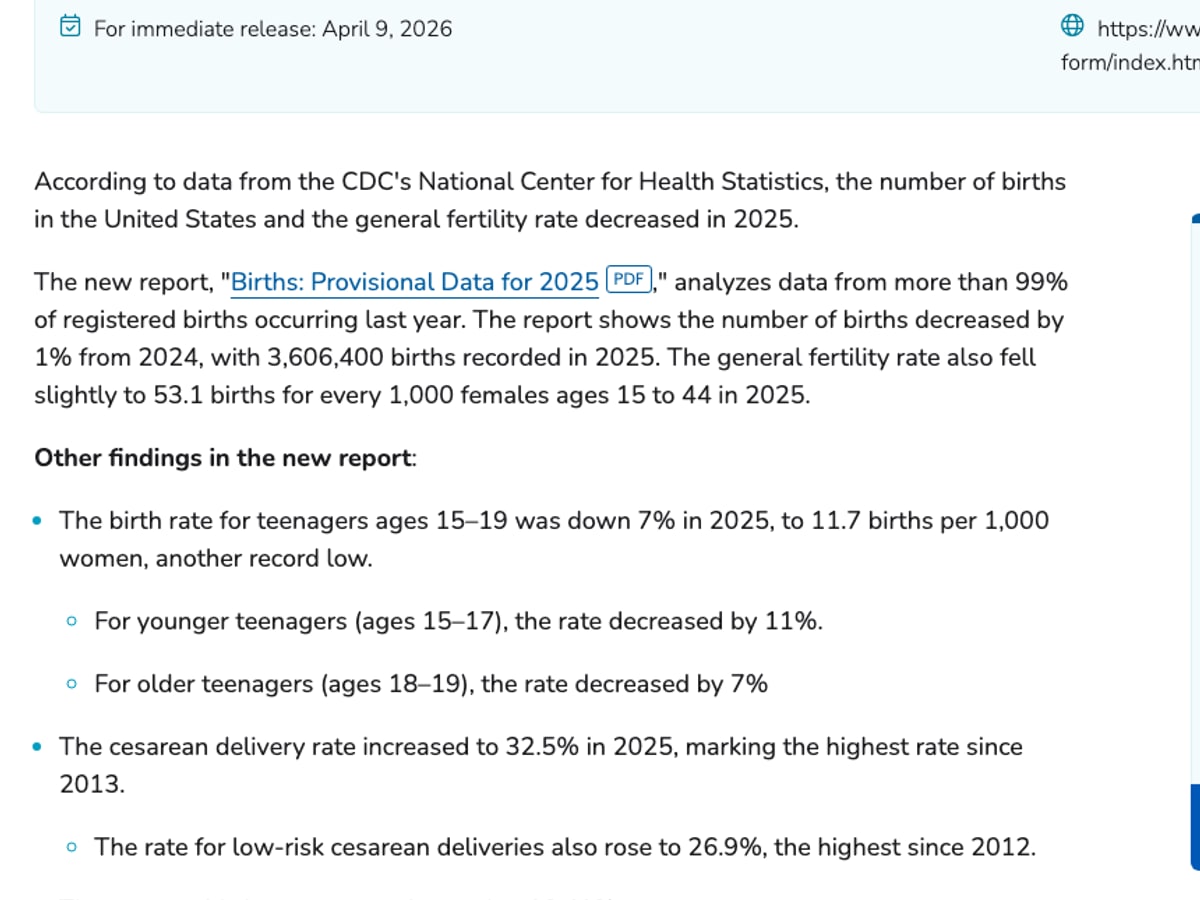
The strongest frame is not replacement rhetoric or apocalyptic decline rhetoric. It is institutional adaptation. NCHS has already reported 3,606,400 provisional U.S. births in 2025, down 1% from 2024, with a general fertility rate of 53.1 births per 1,000 females ages 15 to 44. The same report notes that the general fertility rate has generally declined since 2007, falling 23% over that span. March 2026 belongs inside that longer line, not outside it.
That longer line matters because a country can keep pretending the slowdown is temporary only if it ignores nearly two decades of evidence. Housing costs, childcare costs, delayed marriage, delayed first births, student debt, wage insecurity, and uneven healthcare access all shape whether people can build the families they say they want. None of those pressures disappear because a politician declares a family-values agenda. They are structural conditions, and the birth file is one of the places where those conditions show up.
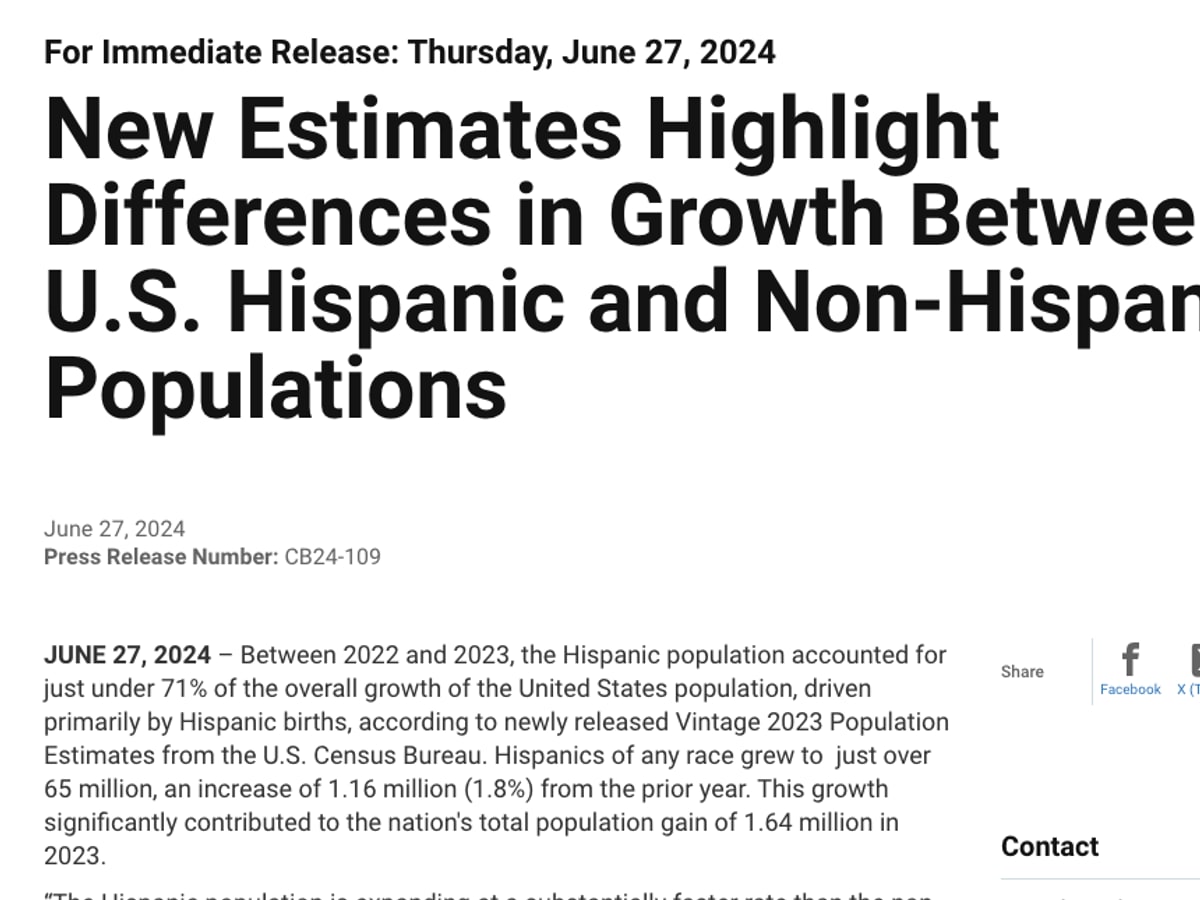
The composition side of the file is just as important. Non-Hispanic White mothers still represent a slim majority of known births in this one-month snapshot, which is a useful correction to overheated claims that demographic change happens in a single leap. But the margin is narrow, Hispanic mothers account for more than one quarter of known births, and the Census Bureau has already shown that Hispanic population growth accounted for just under 71% of total U.S. population growth between 2022 and 2023. The future is not waiting for analysts to update their language.
The sharpest one-month drop in this table appears among Black births at -5.61%. Because the file is provisional, that figure should be treated as a signal that needs scrutiny, not as a finished verdict. It raises real questions about economics, maternal health, regional change, and family formation under pressure. It should not be twisted into a cheap moral narrative about Black families, and it should not be ignored because the implications are uncomfortable.
What the record shows
The attached source trail is sufficient to support several careful claims. CDC WONDER supports the provisional March 2026 monthly counts and the corrected known-birth denominator used in the chart. The NCHS provisional births report supports the low-birth baseline by showing the 2025 total and the longer fertility-rate decline. Census materials support the broader population-growth context and the point that institutions are already planning around age, sex, race, Hispanic origin, and nativity because those variables shape future population structure.
Taken together, the file supports a clear argument: the United States is not only dealing with a lower-birth environment; it is also dealing with a future population whose composition requires updated assumptions in education, labor planning, healthcare, media, and politics. A serious editorial read keeps all three levels visible at once: the monthly signal, the longer birth trend, and the wider population context.
How the source stack works
| Source | What it helps verify | Why it matters |
|---|---|---|
| CDC WONDER provisional natality | Monthly birth counts and category breakdowns | Keeps the analysis tied to the actual March 2026 file |
| NCHS provisional births report | Longer low-birth baseline | Prevents one month from being mistaken for a complete trend |
| Census population materials | Population-growth and planning context | Shows why institutions cannot treat demographic change as a side issue |
What the record does not show
This record does not prove why every category moved the way it did in one month. It does not prove the final annual 2026 birth picture. It does not tell us everything about fathers, households, religion, class, immigration status, family intention, or the lived identity of every child. It also does not authorize racial fear narratives, replacement mythology, or broad claims that one monthly table alone can explain political destiny.
The attached sources are strongest when CultureUp uses them to show sequence and constraint: a monthly provisional signal, a longer low-birth context, and a population-growth frame. If editors want to make stronger causal claims about maternal health systems, childcare access, or region-specific family formation, that next version should add reviewed state, hospital, labor, or policy sources rather than stretching this file beyond what it can carry.
Why this matters for CultureUp readers
CultureUp readers do not need another demographic scare piece. They need a readable explanation of what institutions should be noticing now. School leaders need to understand that enrollment planning can no longer be built on old assumptions. Housing and childcare debates should be read as demographic infrastructure debates. Media and political institutions need to stop talking about Hispanic, Black, Asian, Indigenous, Pacific Islander, and multiracial communities as if they are optional side audiences in the American future.
This is also why data literacy matters. A corrected denominator changes the meaning of a chart. A visible method note changes the trustworthiness of a headline. If CultureUp can teach readers how to read a provisional table, identify what counts as a strong claim, and notice when a story is drifting into spin, then the article does more than summarize data. It builds civic reading habits.
The adaptation question gets concrete fast. A district planning kindergarten enrollment, a hospital planning obstetric capacity, a county modeling childcare demand, and a media institution deciding which families it thinks are central to the country are all reacting to the same demographic ground. If they keep planning for a family landscape that already changed, the practical result is not ideological error alone. It is service error.
That is why this article treats demography as infrastructure reading. Birth counts are not abstractions. They point toward classrooms, clinics, neighborhoods, and cultural institutions that will either adjust to the population being born or keep speaking to a country that is fading behind them.
Media and caption note
This page intentionally uses CultureUp statistical illustrations rather than documentary photography as the main visual system. That is acceptable here because the visuals are depicting data and trend interpretation, not claiming to be historical or documentary evidence. The page still needs explicit caption language stating that the graphics are statistical illustrations built from CDC WONDER and related source material.
The reviewed source images on the page should remain tied to their institutional holders and used as evidence-support objects, not as emotional decoration. Any future expansion should keep the same rule: charts can illustrate the analysis, but they should never be confused with the underlying record.
Source notes and correction path
Published flagship analysis using CultureUp calculations from CDC WONDER provisional natality tables, NCHS birth-trend context, and Census Bureau population context. Categories are mother's race and Hispanic origin, and the monthly data is provisional.